
This post details how, where, and when the death penalty has been applied in the United States. We’ll examine opposition to the death penalty (9 graphs), the deterrence argument (5 graphs), and trends in the death penalty and public opinion (4 graphs).
We used Plotly’s APIs for Python, MATLAB, and R to make these graphs. You can analyze the data and make your own copy by making clicking the links in each plot. For on-premise use: Plotly Enterprise. We used import.io’s Plotly integration to access and share data. This blog post is a cross post with the the import.io blog. Our data comes from the Death Penalty Information Center.
Part 1: Opposition To The Death Penalty
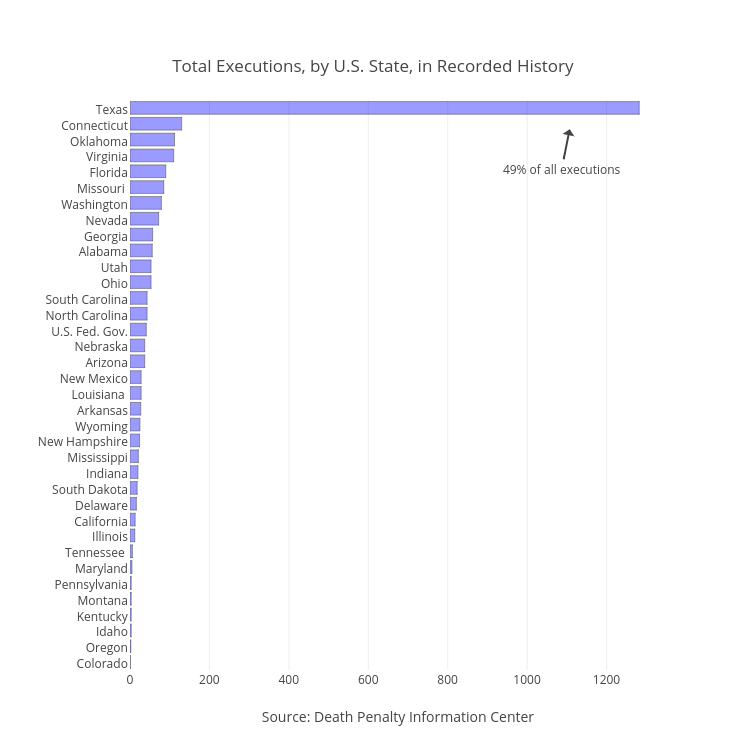
The death penalty is left up to and applied by states. For a visual representation of the geographical applications, study the map below made with Python. Texas executes more people than any other state. Hover your mouse to see data.

This bar chart breaks down the same data and shows the number of executions in each state. One report showed that 2% of counties in the U.S. have been responsible for the majority of cases leading to executions since 1976.
The graph below summarizes the history of executions in the U.S. The gap occurred when the Supreme Court suspended the punishment for a few years, concluding that it was imposed “wantonly” and “freakishly.” The Justices weighed whether it violates the Eighth Amendment’s ban on cruel and unusual punishment.
![Executions by Method]()
Opponents of the penalty argue that it is cruel to have inmates on death row for decades. As of 2014, there were 3,002 inmates on death row in the U.S. This line chart shows the trend with a line of best fit.
![Executions by Method]()
In 1990, the U.S. General Accounting Office concluded that “the victim’s race influenced the likelihood of the defendant being charged with capital murder or receiving the death penalty.”
![<br>Race of Victims in Death Penalty Cases]()
A black defendant accused of murdering a white victim is more likely to receive the death penalty than a white defendant accused of murdering a black victim.
![<br>Executions for Interracial Murders]()
A study on the death penalty in California concluded that:
![<br>Money Spent on California Death Penalty]()
Lethal injection is the most popular method in use (recall our first graph). It is also the most risky. More recent periods have been the worst; between 1980 and 2010, 8.53 percent of executions were botched in some way.
![<br>Percent of Botched Executions, 1900 to 2010]()
DNA analysis and new forensic techniques can exonerate prisoners. The National Registry of Exonerations lists 106 who were sentenced to death who have been exonerated since 1989.
![<b>Exonerations from Death Row</b><br><br><i>Number of Prisoners Sentenced to Death Who Were Later Cleared</i>,<br><i>by Year of Exoneration</i>]()
Some supporters of the death penalty argue that the penalty discourages murderers. The Wall Street Journal published a version of the plot below and wrote an article along these lines:
![<br>Relationship Between Execution and Murder]()
The plot seems convincing. But violent crime overall has diminished in the past two decades. This is a broad trend. Remember that correlation does not imply causation.
![<br><b>Violent Crime in the United States</b>]()
And despite different approaches to the death penalty, homicide rates in the U.S. and Canada are similar. Presumably factors besides the death penalty contribute to homicide rates.
![<br>Homicide Rates and the Death Penalty in the U.S. and Canada]()

Growing Length of Time Between Sentencing and Execution
Opponents of the penalty argue that it is cruel to have inmates on death row for decades. As of 2014, there were 3,002 inmates on death row in the U.S. This line chart shows the trend with a line of best fit.

Race
In 1990, the U.S. General Accounting Office concluded that “the victim’s race influenced the likelihood of the defendant being charged with capital murder or receiving the death penalty.”

A black defendant accused of murdering a white victim is more likely to receive the death penalty than a white defendant accused of murdering a black victim.

Cost
A study on the death penalty in California concluded that:
“a combination of high trial costs, a lengthy appeals process, and incarceration costs for the more than 700 inmates on California’s death row have caused the state to spend well over $4 billion on the death penalty since its reinstatement in 1978.”

Failed Executions and Innocence
Lethal injection is the most popular method in use (recall our first graph). It is also the most risky. More recent periods have been the worst; between 1980 and 2010, 8.53 percent of executions were botched in some way.

DNA analysis and new forensic techniques can exonerate prisoners. The National Registry of Exonerations lists 106 who were sentenced to death who have been exonerated since 1989.

Part 2: The Deterrence Argument
Some supporters of the death penalty argue that the penalty discourages murderers. The Wall Street Journal published a version of the plot below and wrote an article along these lines:
…[O]ur recent research shows that each execution carried out is correlated with about 74 fewer murders the following year.

The plot seems convincing. But violent crime overall has diminished in the past two decades. This is a broad trend. Remember that correlation does not imply causation.

And despite different approaches to the death penalty, homicide rates in the U.S. and Canada are similar. Presumably factors besides the death penalty contribute to homicide rates.

Homicide rates are higher in death penalty states than non-death penalty states.

Examining the data at a state level–as one researcher did for 1998 data–also does not demonstrate a deterrance effect.

Part 3: Trends in the Death Penalty
The United States is the only country in the G7 (major advanced economy) to still execute people. From figures in 2013, the U.S. ranks sixth in the world for the use of capital punishment behind China, North Korea, Iran, Iraq, and Saudia Arabia. The United Nations General Assembly has adopted resolutions calling for a global moratorium on executions. China, India, the United States, and Indonesia have consistently voted against the resolutions.

The number of inmates sentenced to death increased between 1980 and 2010.

Public Opinion
The Gallop Poll Social Series on Crime tracks public opinion on the death penalty. The data below was gathered from a random sample of 1,028 adults. The margin of error is ±4 percentage points, indicated by the error bars on the plot.

Opinions diverge on whether the death penalty is fairly applied.

This is an open question. Earlier this year in a death penalty case, Justice Breyer argued that it is “highly likely that the death penalty violates the Eighth Amendment.” Let us know what you think. Find us at feedback@plot.ly and @plotlygraphs.