Analyzing and graphing data helps us understand our work in science, business, and everyday life. We’ve written this post with a few principles we think about as a startup. We used Plotly’s free web app. Contact us if you’d like to use Plotly Enterprise to power your graphing and collaboration.
![]()
Source: xkcd
There are two types of data teams must be able to differentiate between: vanity metrics relate data that sounds appealing but is ultimately irrelevant while actionable metrics relate data that is relevant to a team.
For example, a startup studying only the first graph below might conclude that things are going well. The second graph reveals that despite the increased traffic, only 1% of visitors are actually signing up. Thus, we could make a new goal: increase not only the number of visitors who sign up, but the proportion thereof.![Number of users in the month of May]()
![Conversions - Visitors Who Signed Up]()
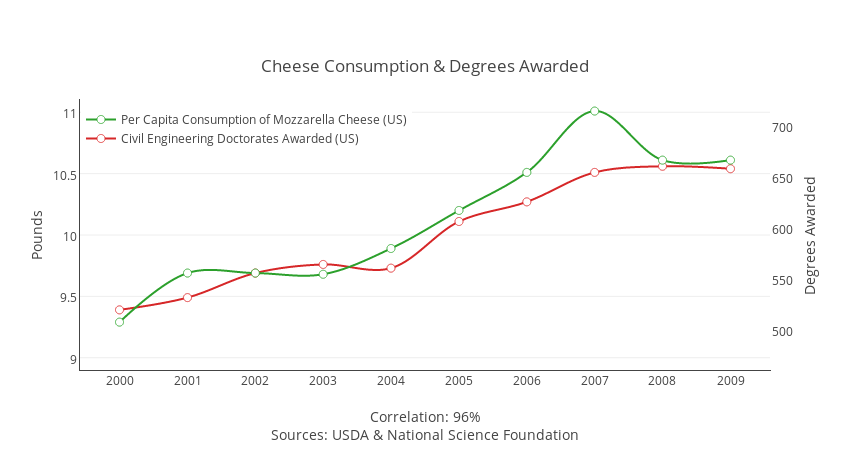
As the comic at the beginning of this post notes, correlation does not imply causation. An increase in sales can’t directly be attributed to a new marketing startegy, just like cheese consumption can’t directly be attributed to doctorates awarded. A “correlation means causation” argument needs to pass further testing, analysis, and study.
![<br>Cheese Consumption & Degrees Awarded]()
Looking at “top 10” for metrics is natural. It can be misleading if the “other” category largely exceeds the top categories for the metric. For example, consider the next two graphs. Most of the traffic is coming from smaller contributors in the “other” category, yet someone looking at the first graph might only focus on Facebook and Twitter. For more on distributions, see heavy-tailed distribution.
![Top 4 Traffic Sources for the Month of May]()
![Traffic Sources for the Month of May]()
Focusing too much on averages can be misleading as they do not accurately portray exactly how the data is dispersed. For example, say that our analytics say that “Average Time Spent” on the site is 1 minute and 33 seconds. Yet graphing out all the times spent on the site yields this:
![Number of Seconds Spent on Site by Users]()
The two factors to analyze are (1) that many users are leaving the site in under 10 seconds, and (2) that a portion of them stay between 181 and 1800 seconds. In this case, the average does not explain how users are interacting with the site. Pro tip: look at a histogram or a boxplot to get a better feel for a distribution.
Analyzing data is not easy. We hope this post helps. Has your team made or avoided any of these mistakes? Do you have suggestions for a future post? Let us know; we’re @plotlygraphs, or email us at feedback at plot dot ly.

Source: xkcd
1. Choose The Right Metrics
There are two types of data teams must be able to differentiate between: vanity metrics relate data that sounds appealing but is ultimately irrelevant while actionable metrics relate data that is relevant to a team.
For example, a startup studying only the first graph below might conclude that things are going well. The second graph reveals that despite the increased traffic, only 1% of visitors are actually signing up. Thus, we could make a new goal: increase not only the number of visitors who sign up, but the proportion thereof.


2. Correlation vs. Causation
As the comic at the beginning of this post notes, correlation does not imply causation. An increase in sales can’t directly be attributed to a new marketing startegy, just like cheese consumption can’t directly be attributed to doctorates awarded. A “correlation means causation” argument needs to pass further testing, analysis, and study.
3. Ignoring the Tail
Looking at “top 10” for metrics is natural. It can be misleading if the “other” category largely exceeds the top categories for the metric. For example, consider the next two graphs. Most of the traffic is coming from smaller contributors in the “other” category, yet someone looking at the first graph might only focus on Facebook and Twitter. For more on distributions, see heavy-tailed distribution.


4. Avoid Averages
Focusing too much on averages can be misleading as they do not accurately portray exactly how the data is dispersed. For example, say that our analytics say that “Average Time Spent” on the site is 1 minute and 33 seconds. Yet graphing out all the times spent on the site yields this:

The two factors to analyze are (1) that many users are leaving the site in under 10 seconds, and (2) that a portion of them stay between 181 and 1800 seconds. In this case, the average does not explain how users are interacting with the site. Pro tip: look at a histogram or a boxplot to get a better feel for a distribution.
Analyzing data is not easy. We hope this post helps. Has your team made or avoided any of these mistakes? Do you have suggestions for a future post? Let us know; we’re @plotlygraphs, or email us at feedback at plot dot ly.